Plant Hardiness Zones Between 2012 and 2023

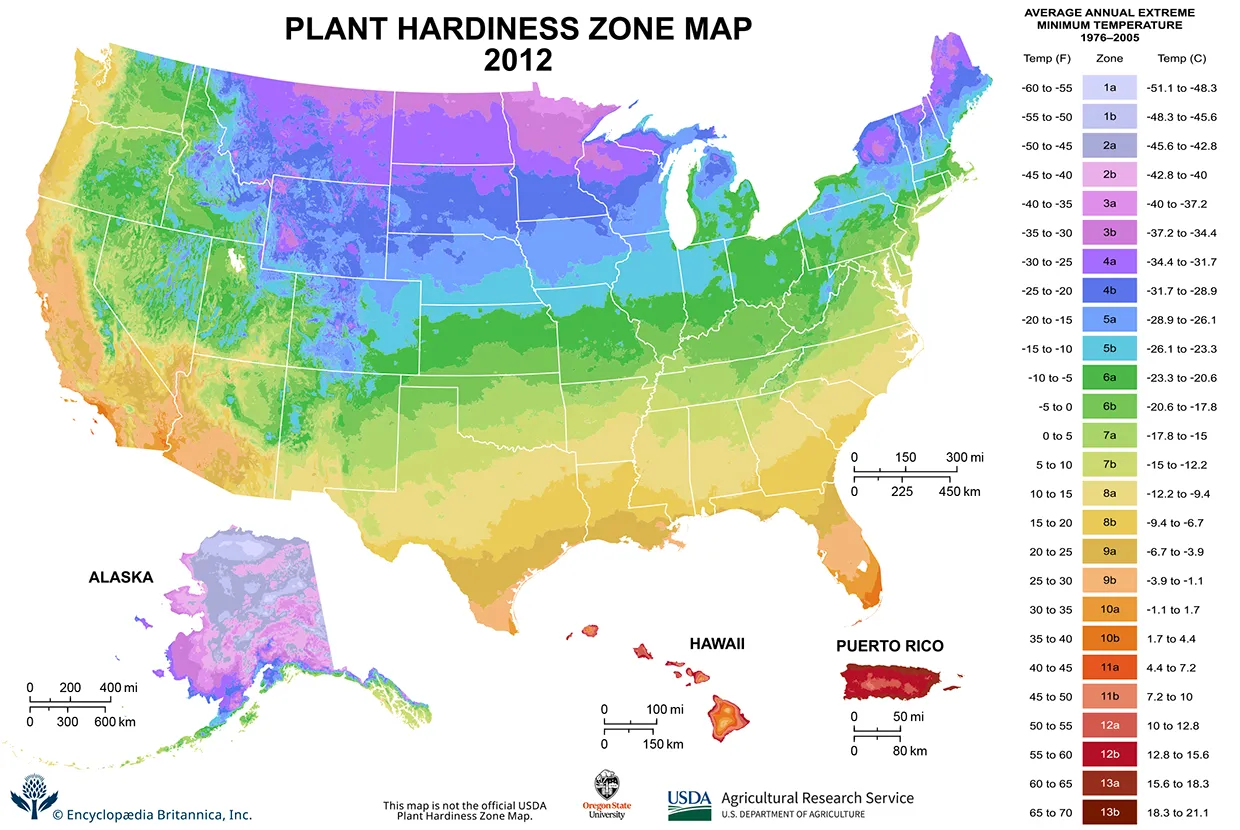
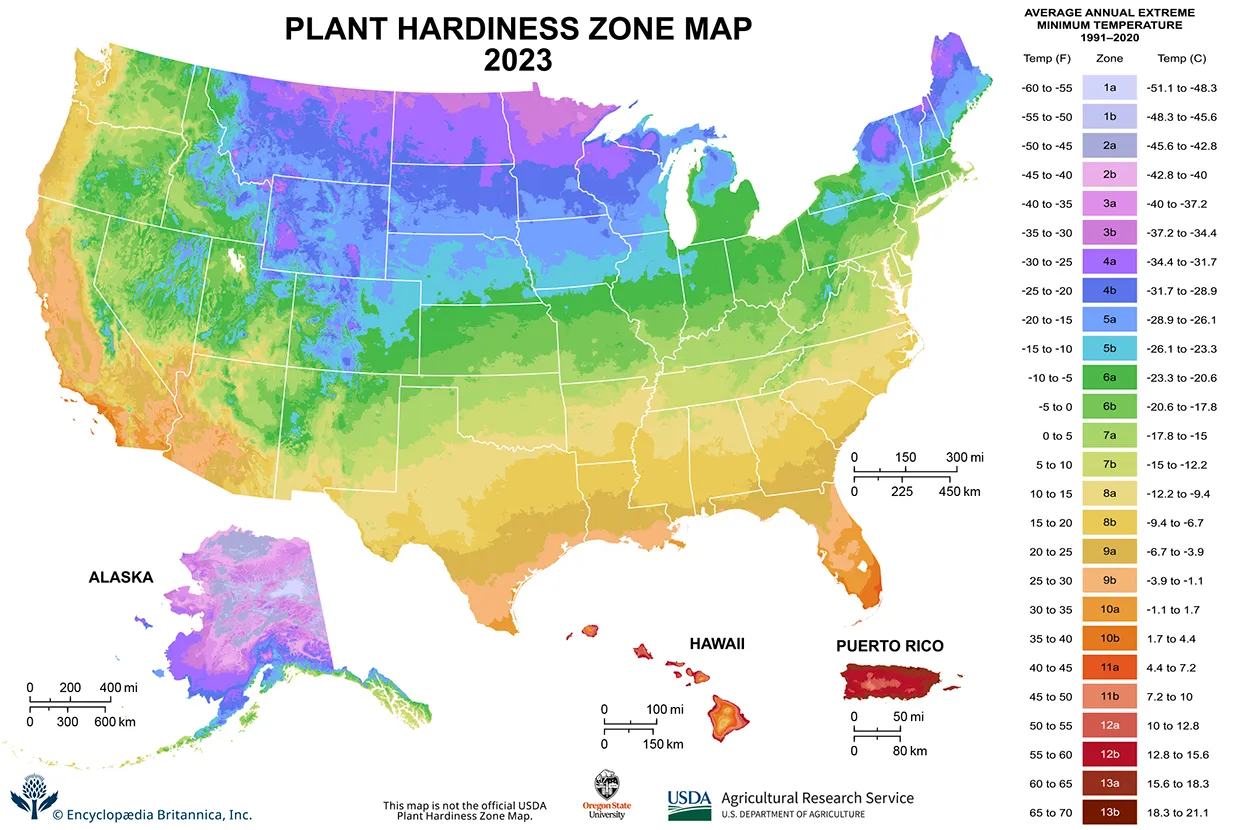
A comparison of the 2012 USDA Plant Hardiness Zone Map (left) with the 2023 version. The 13 plant hardiness zone designations, each divided into two 5 °F (2.8 °C) half zones, represent the average annual extreme minimum temperature at a given location over the past 30 years. Using either your mouse or left arrow key, drag the slider to reveal the photo.

A slider comparing two images. The first image is a map of the United States with a color gradient representing the average annual extreme temperature from 1976 to 2005. The title reads, Plant Hardiness Zone Map, 2012. The northern regions of the country show the coldest average extereme minimum temperatures, with an even gradient trending toward warmer temperatures in the southern regions. The second image is a map of the U.S. showing the average annual extreme temperature from 1991 to 2020, showing notably warmer minimum temperatures in almost every region across the U.S. The title reads, Plant Hardiness Zone Map, 2023. On the right of both images is a legend titled, Average Annual Extreme Minimum Temperatures, with 26 categories identified by a color gradient and the categories 1a to 13b.

Credits: Agricultural Research Service, U.S. Department of Agriculture
© Encyclopædia Britannica, Inc.